Unlocking the Secrets to Mastering the MACD Indicator for Success in Cryptocurrency Trading
What Is the Significance of the MACD Line in Trading Analysis?
The MACD, an acronym for Moving Average Convergence Divergence, stands as a fundamental tool in the arsenal of traders, serving as a trend-following momentum indicator that depicts the relationship between two essential moving averages of a cryptocurrency’s price. This critical resource empowers traders to identify potential market trend shifts. For example, when the MACD line ascends above the signal line, it generally indicates a promising buying opportunity, particularly evident during significant Bitcoin bullish rallies. Conversely, a downward cross below the signal line could indicate a sell signal, providing traders with crucial insights to navigate the volatile landscape of cryptocurrency markets effectively.
Key Components That Enhance the Functionality of the MACD Indicator
The MACD is composed of several integral components that enhance its effectiveness in cryptocurrency market analysis. A thorough understanding of these elements is essential for traders looking to utilize MACD proficiently within their trading strategies. The primary components include:
- MACD Line: This line indicates the difference between the 12-period and 26-period exponential moving averages (EMAs), which are essential for identifying trends.
- Signal Line: This is a 9-period EMA of the MACD line that serves as a crucial indicator for spotting potential buy and sell signals.
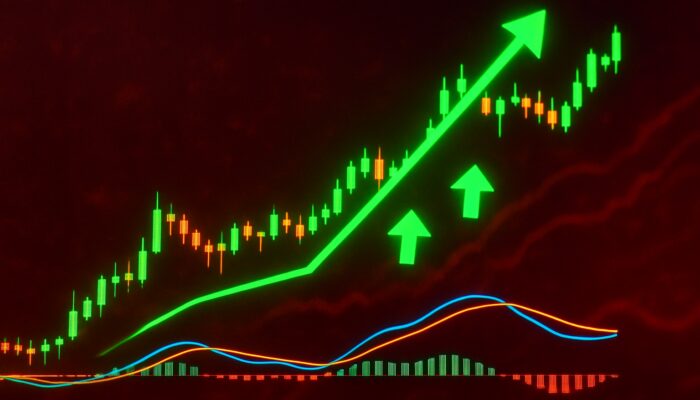
- Histogram: This graphical representation illustrates the difference between the MACD line and the signal line, effectively showcasing the strength of market momentum.
- Zero Line: Acting as a baseline, the zero line assists traders in determining whether the current trend is bullish or bearish.
Each of these components plays a vital role in guiding traders toward making informed decisions regarding their positions within the dynamic and often unpredictable cryptocurrency market.
How Does MACD Stand Out Compared to Other Technical Indicators?
MACD distinguishes itself in the cryptocurrency trading arena due to its unique combination of trend-following and momentum characteristics. Unlike other tools such as the Relative Strength Index (RSI), which primarily focuses on measuring overbought or oversold conditions, MACD excels at detecting momentum shifts and assessing the strength of existing trends. This adaptability renders MACD an invaluable asset for traders employing momentum-based strategies, allowing them to capitalize on both short-term price fluctuations and longer-term trends effectively.
What Is the Efficient Method for Calculating the MACD Indicator?
The computation of MACD involves subtracting the 26-period exponential moving average (EMA) from the 12-period EMA, resulting in the MACD line. Additionally, a 9-period EMA is calculated to create the signal line. In the context of cryptocurrency trading, this calculation is essential for identifying momentum shifts that are critical for informed trading decisions. For instance, during notable price rallies in Bitcoin, traders using the MACD can more effectively anticipate potential trend reversals, optimizing their entry and exit points. Such careful calculations foster a nuanced understanding of price movements, ultimately enhancing the overall effectiveness of trading strategies.
How Can Traders Interpret MACD Divergences for Improved Trading Outcomes?
MACD divergences occur when the indicator moves inversely to the price, signaling possible market reversals. For example, in the cryptocurrency markets, a bullish divergence may manifest when the MACD records higher lows while the underlying asset, such as Ethereum, exhibits lower lows. This scenario suggests a potential upward price trend, offering traders an opportunity to capitalize on anticipated price increases. To minimize the risk of false signals, it is crucial to confirm MACD divergences using additional technical indicators or analysis techniques, thus ensuring a more robust and reliable trading strategy.
Insights from Experts on Leveraging MACD in Cryptocurrency Trading
What Are the Advanced MACD Calculation Techniques for Optimal Trading Results?

Diving into the intricate calculations behind MACD unveils opportunities to optimize its parameters specifically for the cryptocurrency market. Traders can adjust the typical periods (12, 26, and 9) based on current market volatility to enhance the indicator’s responsiveness. For instance, in a highly volatile trading environment, shortening the EMA periods may allow traders to capture more immediate price movements, resulting in timely trading signals. By consistently backtesting these adjustments against historical data, traders can refine their MACD setups to align with the distinct characteristics of various cryptocurrencies, ultimately leading to improved trading outcomes.
What Is the Best Approach to Interpret MACD Signals for Trading Success?
Understanding the complex nuances of MACD signals, including signal crossovers and divergences, is crucial for successful trading. A common situation occurs when the MACD line crosses above the signal line, indicating potential buying opportunities. Professional traders often recognize these crossovers as bullish indicators during rallies in cryptocurrencies like Litecoin. Furthermore, they frequently analyze divergences in MACD to predict market reversals. By integrating these signals with fundamental analysis or other technical indicators, traders can more accurately forecast market movements and optimize their positions accordingly.
What Should Traders Be Aware of Regarding the Limitations of MACD?
While MACD presents numerous advantages, it also has limitations, particularly concerning false signals that can mislead traders. In volatile market conditions, MACD may generate numerous buy and sell signals that do not align with overarching trends. To mitigate these risks, traders should consider utilizing supplementary technical indicators, such as volume analysis or trend lines, to validate MACD readings. By adopting a multi-faceted approach, traders can enhance their decision-making processes, leading to more reliable results in the intricate landscape of cryptocurrency trading.
Effective Strategies for Applying MACD in Cryptocurrency Trading
What Are the Essential Steps to Set Up the MACD Indicator for Trading?
Incorporating MACD into a trading platform is a straightforward yet highly effective process that yields valuable insights for cryptocurrency analysis. Begin by selecting a trading chart that supports various technical indicators, such as TradingView or other well-known platforms. Navigate to the indicators section and search for MACD. After integrating it into your chart, customize the parameters to match the specific market conditions of the cryptocurrency you are analyzing. Tailoring the periods can significantly enhance the indicator’s responsiveness to price movements, transforming it into a powerful asset for traders.
Why Is MACD Considered an Optimal Tool for Day Trading?
MACD proves particularly beneficial for short-term cryptocurrency trades due to its ability to swiftly identify momentum shifts and potential trend reversals. This functionality enables day traders to take advantage of rapid price fluctuations. Key benefits include its straightforward interpretation of signals and adaptability to diverse market conditions. Traders can maximize the effectiveness of MACD by diligently monitoring the indicator throughout the trading day, adjusting strategies in alignment with prevailing trends while ensuring prompt responses to emerging opportunities.
How Can MACD Be Combined with Other Analytical Tools for Enhanced Trading Performance?
Integrating MACD with additional analytical tools significantly enhances overall trading performance. For instance, coupling MACD with volume indicators can provide complementary insights, enabling traders to assess the strength behind price movements. When MACD signals align with increased trading volumes, this often indicates strong commitment to prevailing price trends, boosting traders’ confidence in their decisions. Moreover, incorporating price action analysis can assist traders in identifying patterns and refining their entry and exit strategies, resulting in a more comprehensive approach that leverages the strengths of various indicators.
What Are the Key Advantages of Using MACD in Cryptocurrency Trading?
How Does MACD Aid in Identifying Trends in Cryptocurrency Markets?
MACD plays a vital role in trend identification within the cryptocurrency market by effectively highlighting shifts in momentum. This capability offers numerous advantages for traders, including:
- Early Alerts: MACD can provide signals of momentum changes before actual price reversals occur.
- Versatility: Its applicability across various cryptocurrencies makes it a universal trading tool.
- User-Friendly: The simplicity of MACD enhances its accessibility for traders at all experience levels.
- Comprehensive Analysis: It aids in confirming trends when used in conjunction with other indicators.
Utilizing MACD not only enhances traders’ ability to identify trends but also equips them with the necessary insights to navigate the complexities of the cryptocurrency market effectively.
What Are the Possible Drawbacks Associated with Using MACD?
Nevertheless, challenges exist when employing MACD, particularly its tendency to lag in signaling trends due to its reliance on moving averages. This lag may result in missed opportunities or delayed entries and exits. To counteract these issues, traders should consider strategies such as utilizing shorter periods for MACD calculations, which can improve the indicator’s responsiveness. Additionally, integrating MACD signals with other analytical tools can strengthen trend confirmation and enhance decision-making processes, ensuring that traders maintain a competitive advantage in the fast-paced cryptocurrency environment.
Is MACD Suitable for Beginner Traders in Cryptocurrency?
Absolutely, MACD is an accessible option for novice cryptocurrency traders, thanks to its straightforward design and ease of interpretation. This indicator effectively supports foundational trading strategies, empowering beginners to grasp essential concepts without becoming overwhelmed by complexity. As traders accumulate experience, they can delve deeper into MACD’s intricacies, adapting it to more advanced strategies. Thus, MACD serves as an outstanding entry point for those embarking on their cryptocurrency trading journey.
How Can Traders Tailor MACD for Enhanced Cryptocurrency Trading Outcomes?
Customizing MACD parameters allows traders to align the indicator with specific cryptocurrency assets, thereby improving signal accuracy and adaptability. By adjusting the standard periods (12, 26, and 9) based on current market conditions, traders can fine-tune their strategies to optimize performance. For example, in a highly volatile market, reducing the periods may yield quicker signals, while in more stable conditions, standard settings may suffice. This flexibility not only enhances decision-making but also ensures that traders are well-prepared to navigate the unique challenges presented in the cryptocurrency landscape.
What Real-World Scenarios Demonstrate the Effectiveness of MACD?
Real-world applications of MACD in cryptocurrency trading illustrate its ability to pinpoint lucrative entry and exit points. For instance, during significant Bitcoin rallies, traders effectively employing MACD identified optimal buying opportunities at crucial support levels. Similarly, during Ethereum corrections, MACD divergences signaled traders to exit positions before major downturns. These examples highlight MACD’s role in generating timely signals, boosting trader confidence, and potentially increasing returns through proven historical successes.
Proven Strategies for Effectively Utilizing MACD in Cryptocurrency Trading
How to Create a MACD-Based Trading Strategy for Success?
Developing a reliable MACD-based strategy involves several actionable steps tailored to individual trading objectives and risk tolerances. Initially, traders should clearly define their goals, determining whether they seek short-term gains or long-term investments. Following this, establishing a robust risk management framework is crucial, which should include setting stop-loss levels and determining position sizes based on overall portfolio considerations. Incorporating MACD signals for entry and exit points can guide decision-making, promoting a disciplined approach that minimizes emotional trading. Regularly reviewing and refining this strategy based on performance metrics will help traders remain aligned with market fluctuations.
What Common Patterns Can Be Identified in MACD Usage?
Expert analysis reveals recurring patterns in cryptocurrency trading with MACD that can lead to improved outcomes. A prevalent pattern is the emergence of bullish or bearish divergences, where price movements contradict MACD signals, offering early warnings of potential market reversals. Traders who can recognize these divergences can strategically position themselves to benefit from imminent shifts in market direction. Additionally, identifying MACD crossovers can serve as reliable indicators for determining entry and exit points, ensuring that traders align their strategies with prevailing trends. By understanding these patterns, traders can significantly enhance their decision-making processes.
How to Optimize MACD for Long-Term Cryptocurrency Investment Strategies?
Adapting MACD for long-term cryptocurrency investments necessitates a nuanced approach that aligns the indicator with broader market trends and sustainability. Traders should contemplate extending the periods used in MACD calculations to capture the more gradual momentum shifts characteristic of long-term holdings. This adjustment minimizes the impact of short-term volatility, allowing traders to focus on overarching trends. Furthermore, employing MACD alongside fundamental analysis can provide a more comprehensive market perspective, assisting long-term investors in making informed decisions regarding asset allocations and adjustments based on macroeconomic factors.
How to Effectively Utilize MACD Divergences for Successful Cryptocurrency Trading?
Effectively leveraging MACD divergences is essential for identifying potential trend reversals in the cryptocurrency market. Traders should become proficient at detecting both bullish and bearish signals, where the MACD diverges from price action. For example, a bullish divergence occurs when the price makes lower lows while the MACD registers higher lows, indicating a possible upward trend. This strategy becomes even more potent when combined with price action analysis, reinforcing the indication of a reversal. Implementing stop-loss strategies alongside these signals can help mitigate risks while maximizing potential gains, providing a robust framework for successful trading.
Strategies to Avoid Common Pitfalls in MACD Usage
What Are the Common Mistakes Traders Make When Using MACD?
Traders often neglect critical market conditions when applying MACD, leading to suboptimal decision-making. For instance, overlooking overarching market trends may result in reacting to false signals produced by MACD. To avoid such pitfalls, traders should maintain a comprehensive view of market dynamics, ensuring they contextualize MACD signals within broader trends. Supplementing MACD analysis with additional tools and indicators can create a more rounded trading strategy, thereby reducing the likelihood of hasty decisions based on incomplete data.
What Risks Are Associated with Overreliance on MACD Signals?
While MACD is a powerful analytical tool, overreliance on its signals can expose traders to considerable risks. Depending solely on MACD without considering other analytical frameworks may lead to misinterpretations of market movements. Diversifying analytical approaches is crucial; traders should also incorporate indicators such as Bollinger Bands or Candlestick patterns, which provide additional context and confirmation for their strategies. By maintaining a comprehensive toolkit, traders can enhance their decision-making processes and navigate the complexities of the cryptocurrency market with greater efficacy.
How Should Traders Continuously Refine Their MACD Techniques?
Improving the application of MACD over time requires adopting iterative methods that focus on performance evaluation. Traders should regularly review their past trades, identifying instances where MACD signals were either effective or resulted in losses. By documenting these outcomes, traders can refine their strategies, adjusting MACD parameters or integrating additional indicators based on insights gained from their performance. This commitment to continuous improvement empowers traders to adapt their techniques, ensuring they remain competitive in the ever-evolving cryptocurrency trading landscape.
What Are the Consequences of Overlooking MACD Divergences?
In cryptocurrency trading, failing to recognize MACD divergences can mislead traders into false breakouts or reversals. This pitfall often stems from not correlating histogram patterns with price action, which can lead to missed opportunities or financial setbacks. To mitigate this risk, it is vital to cross-verify MACD divergences with volume data and trend lines, fostering a more robust trading strategy. By incorporating these checks, traders can enhance their accuracy in interpreting MACD signals, ultimately improving their trading outcomes and reducing the likelihood of significant financial losses.
Frequently Asked Questions (FAQs) Regarding MACD in Cryptocurrency Trading
What Is MACD and Its Importance in Cryptocurrency Trading?
MACD, or Moving Average Convergence Divergence, is a trend-following momentum indicator utilized to analyze price trends within cryptocurrencies by illustrating the relationship between two moving averages.
What Is the Method for Calculating MACD?
MACD is calculated by subtracting the 26-period EMA from the 12-period EMA, resulting in the MACD line, which is combined with a 9-period EMA to form the signal line that generates trading signals.
What Defines a Bullish Divergence in MACD Analysis?
A bullish divergence arises when the price creates lower lows while the MACD records higher lows, indicating a potential upward price reversal in the cryptocurrency market.
Why Is MACD Essential for Traders?
Traders leverage MACD to identify momentum shifts and possible trend reversals, making it a critical analytical tool for assessing price movements in cryptocurrency markets.
How Can Beginners Effectively Learn to Use MACD?
Beginners can learn to use MACD by studying its components, practicing its application in various market scenarios, and integrating it with other technical analysis tools for a better understanding.
What Are the Main Limitations Associated with MACD?
The limitations of MACD include its tendency to lag due to reliance on moving averages, which may lead to delayed signals and missed opportunities in fast-changing markets.
Is It Possible to Customize MACD for Different Cryptocurrencies?
Yes, MACD can be tailored by adjusting the standard periods (12, 26, 9) to align with the unique volatility and price action characteristics of various cryptocurrencies.
What Strategies Can Enhance MACD's Effectiveness?
Strategies that enhance MACD effectiveness include combining it with other indicators, adjusting parameters based on market conditions, and analyzing volume and price action for confirmation.
What Common Errors Do Traders Make When Utilizing MACD?
Common errors include overlooking significant market conditions, overly relying on MACD signals alone, and failing to recognize divergences, which can lead to suboptimal trading decisions.
How Often Should Traders Review Their MACD Strategies?
Traders should regularly assess their MACD strategies following significant trades or market developments, ensuring consistent improvement and adaptation to evolving market dynamics.


No responses yet